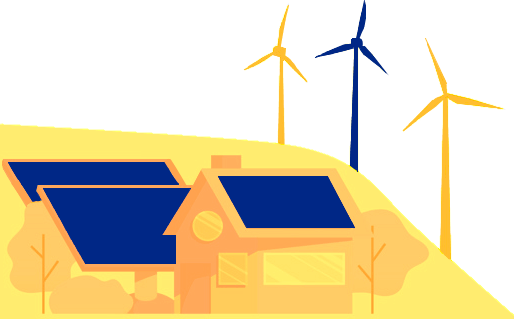
Transportation
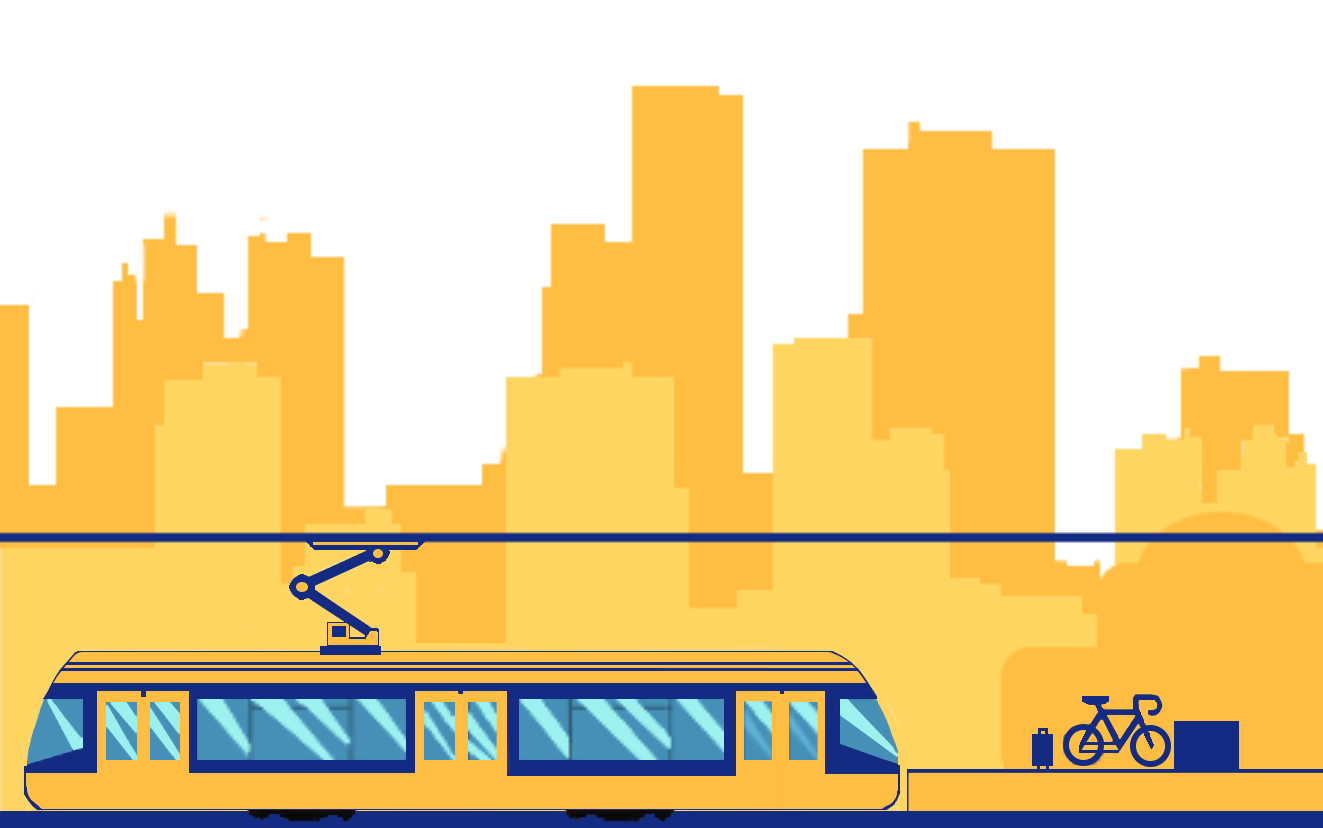
Our team at GIS Sensing helps transportation designers and engineers answer pressing questions. By offering tools and support throughout the design, construction, and implementation of new transportation projects we're actively answering questions for the following topics.
Traffic Modeling to Assess Impact of New Designs and Development
One of our analysts was helping rebuild the roads after the 2011 earthquake in New Zealand when a city's Traffic Engineer joked, "We have to run every design change through the model and make sure it won't break the network." While quite timely as only 29% of their roadways were standing when he spoke, it's a great point of how carefully designers must consider additions to avoid creating more problems. This Traffic Engineer was referencing how minor changes to roadway design can affect flow and unintentionally create bottlenecks. Occurrences which are actually quite reliably modeled when input with data on a region's traffic counts, the population's in-demand trip destinations and origins, and the roadway supply of possible routes. When put into GIS, these traffic modeling datasets become layers of network information which highlight potential opportunities and problems.
Opportunities such as identifying a heavily used route between two locations with potential to reduce congestion by adding pleasant sidewalk landscaping, affordable rapid public transit, protected bike lanes, and free rental bike hubs. A well done traffic model can save your populace time and money by making these opportunities obvious between demand and supply locations.
Problems such as identifying traffic junctions where modes of different speed and mass cross paths with limited to no protection between, a situation which generally results in injury, or likely death if the speed of the motorway is high enough. This is the reason Dutch and Danish best design practices target and eliminate areas where pedestrians and cyclists may cross high speed motorways without protected crossings. Protected crossings can be stopping motorized traffic with a "bike light" so the cyclists can get across without traffic speeding at them or a physical "bike bridge" to completely negate intersections for these slower and faster modes. Physical separation is generally the most successful at reducing serious injury and fatalities. Furthermore, the increased safety of these fixed problem areas will encourage pedestrian and cycling modal share. A necessity as people will not use a mode of transportation unless they perceive it to be accessible, safe, and reliable.
Where Your Population Lives and How They Get to Work
People use roads and transit lines because they're going from point A to B. Most cities see high network usage during commute times, when people are consistently moving between origins and destinations. For most commuters these are the same point A and B almost every work day all year round, with the occasional exception of trip-chained stops for groceries and other errands. This means their network usage is predictable. Municipalities decreasing congestion during commute times assess which neighborhoods people live in and where they travel to during these periods. These travel surveys allow for transit routes and new infrastructure networks to be optimized for incoming and outgoing flow between destinations. With improved results from non-systematic designs which are typically one-time and with limited scope or connection to the wider network. Rather, a systematically designed network more accurately serves the huge number of people who may need to use it.
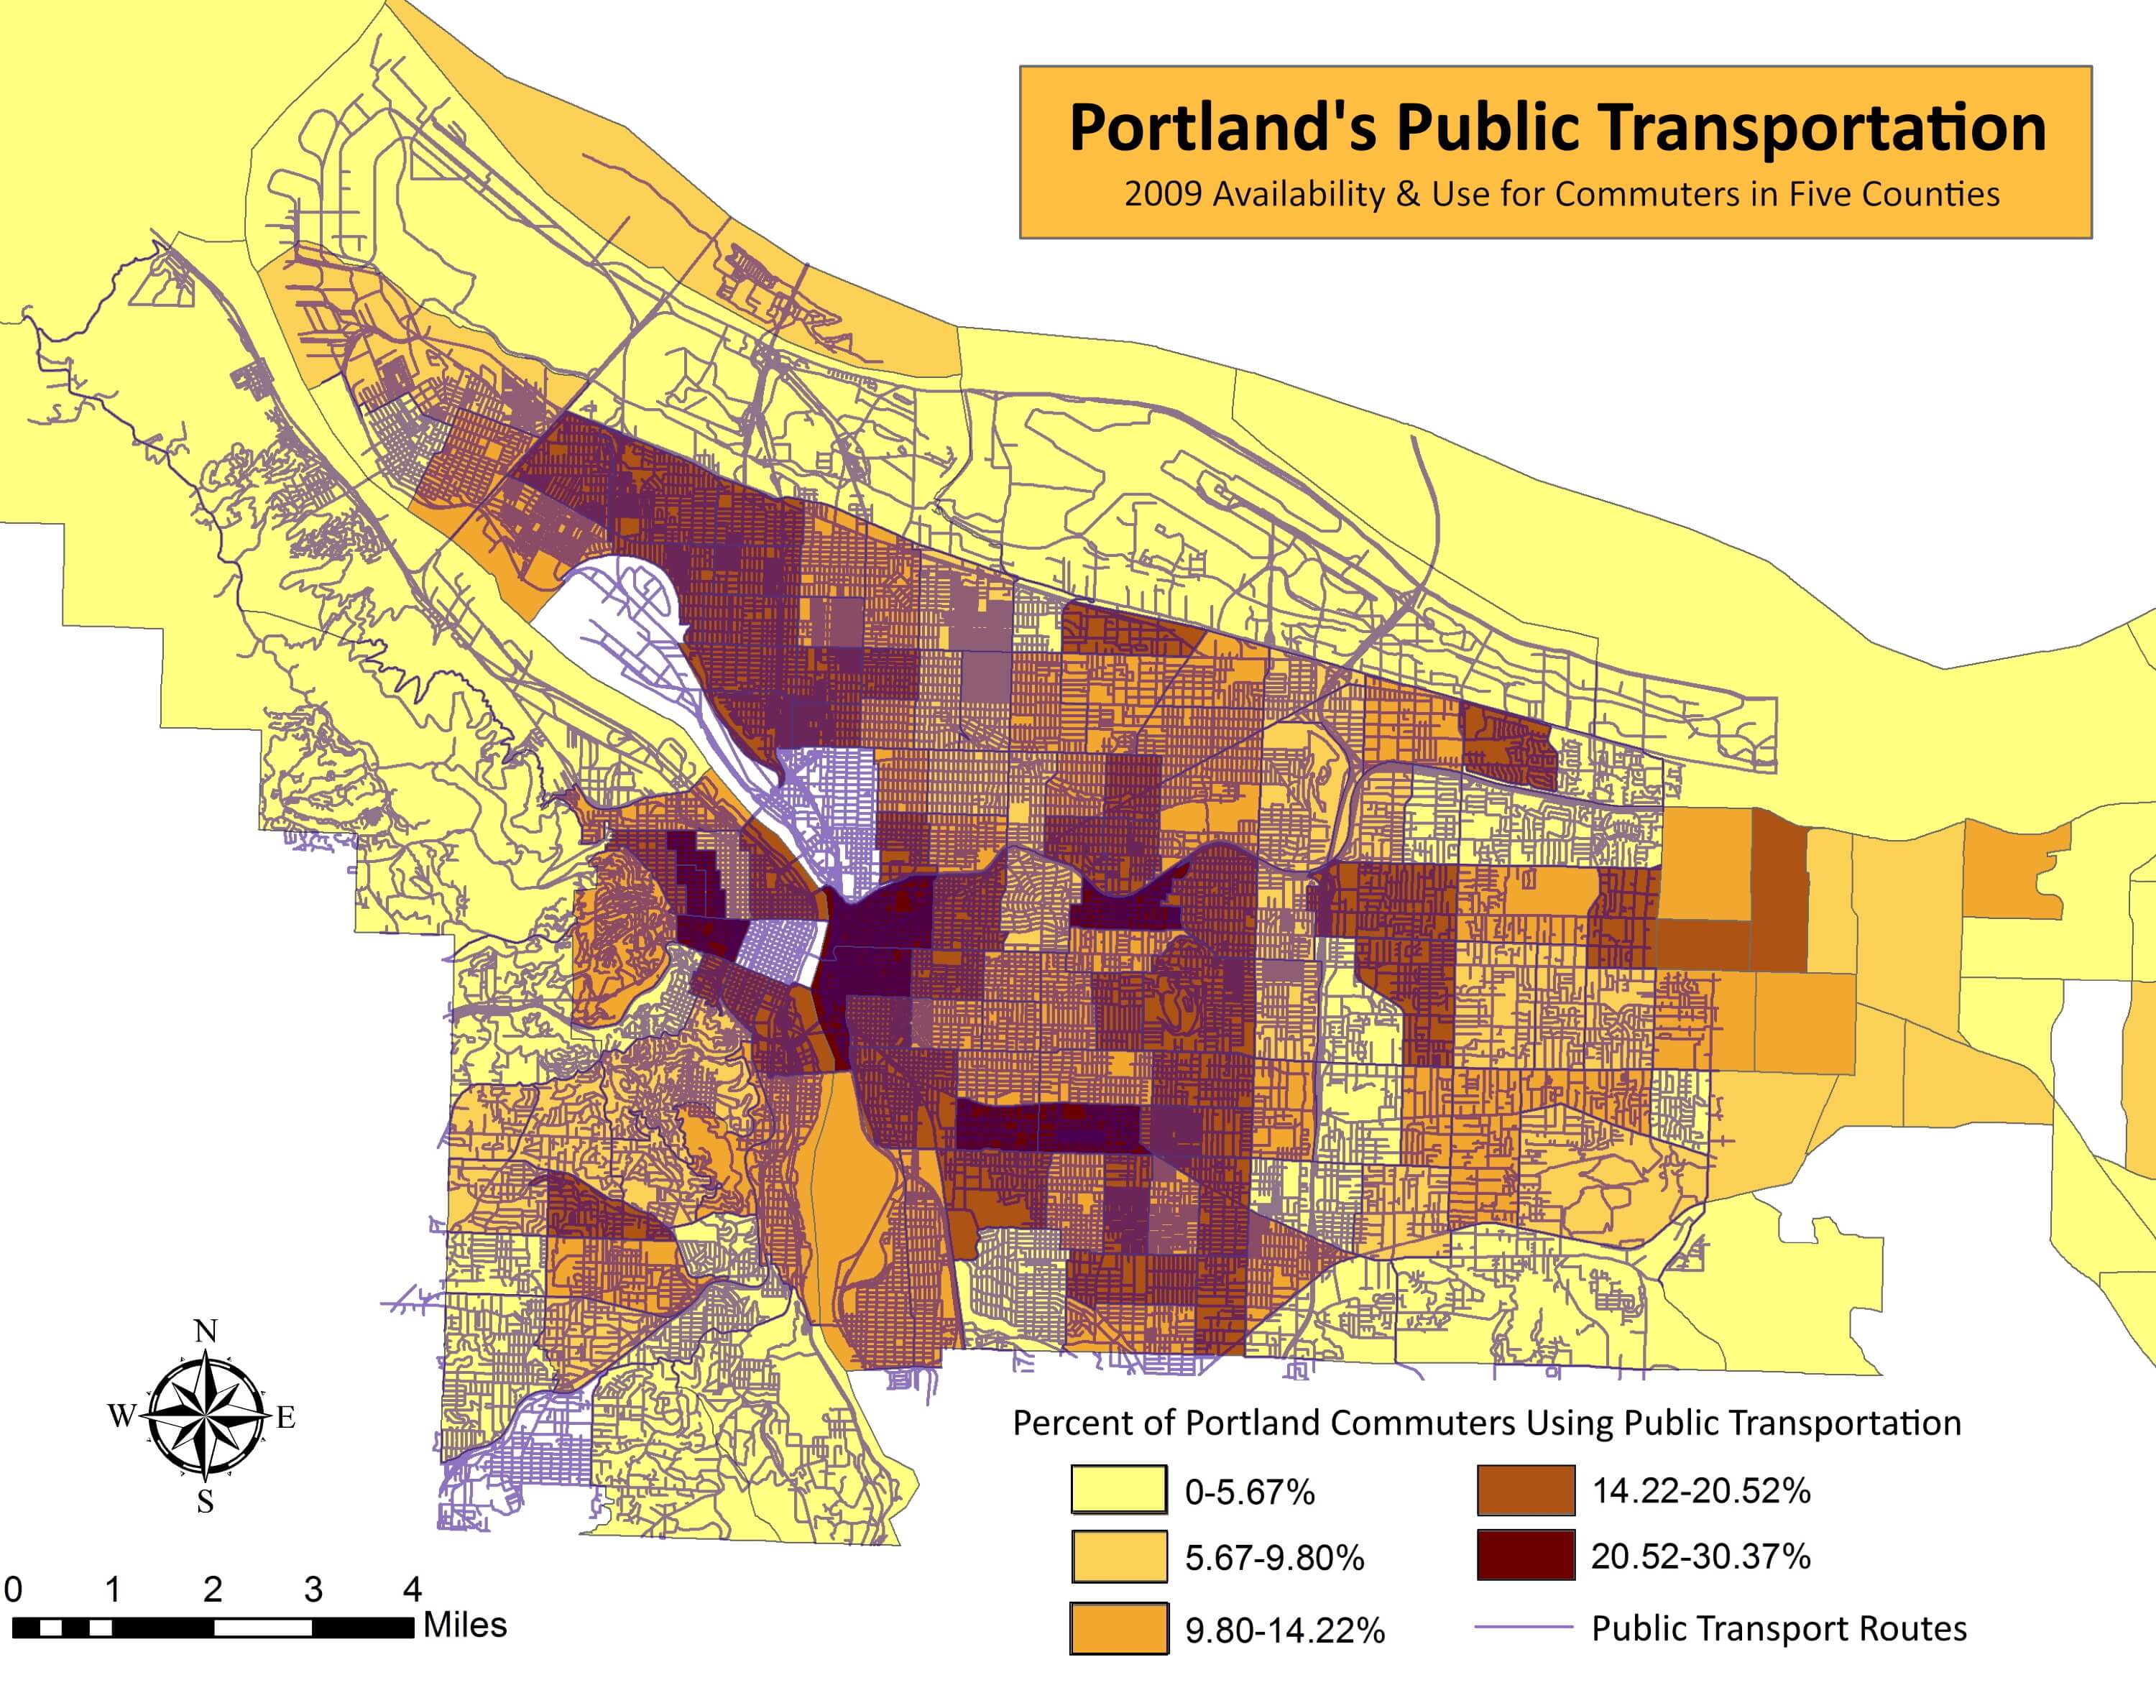
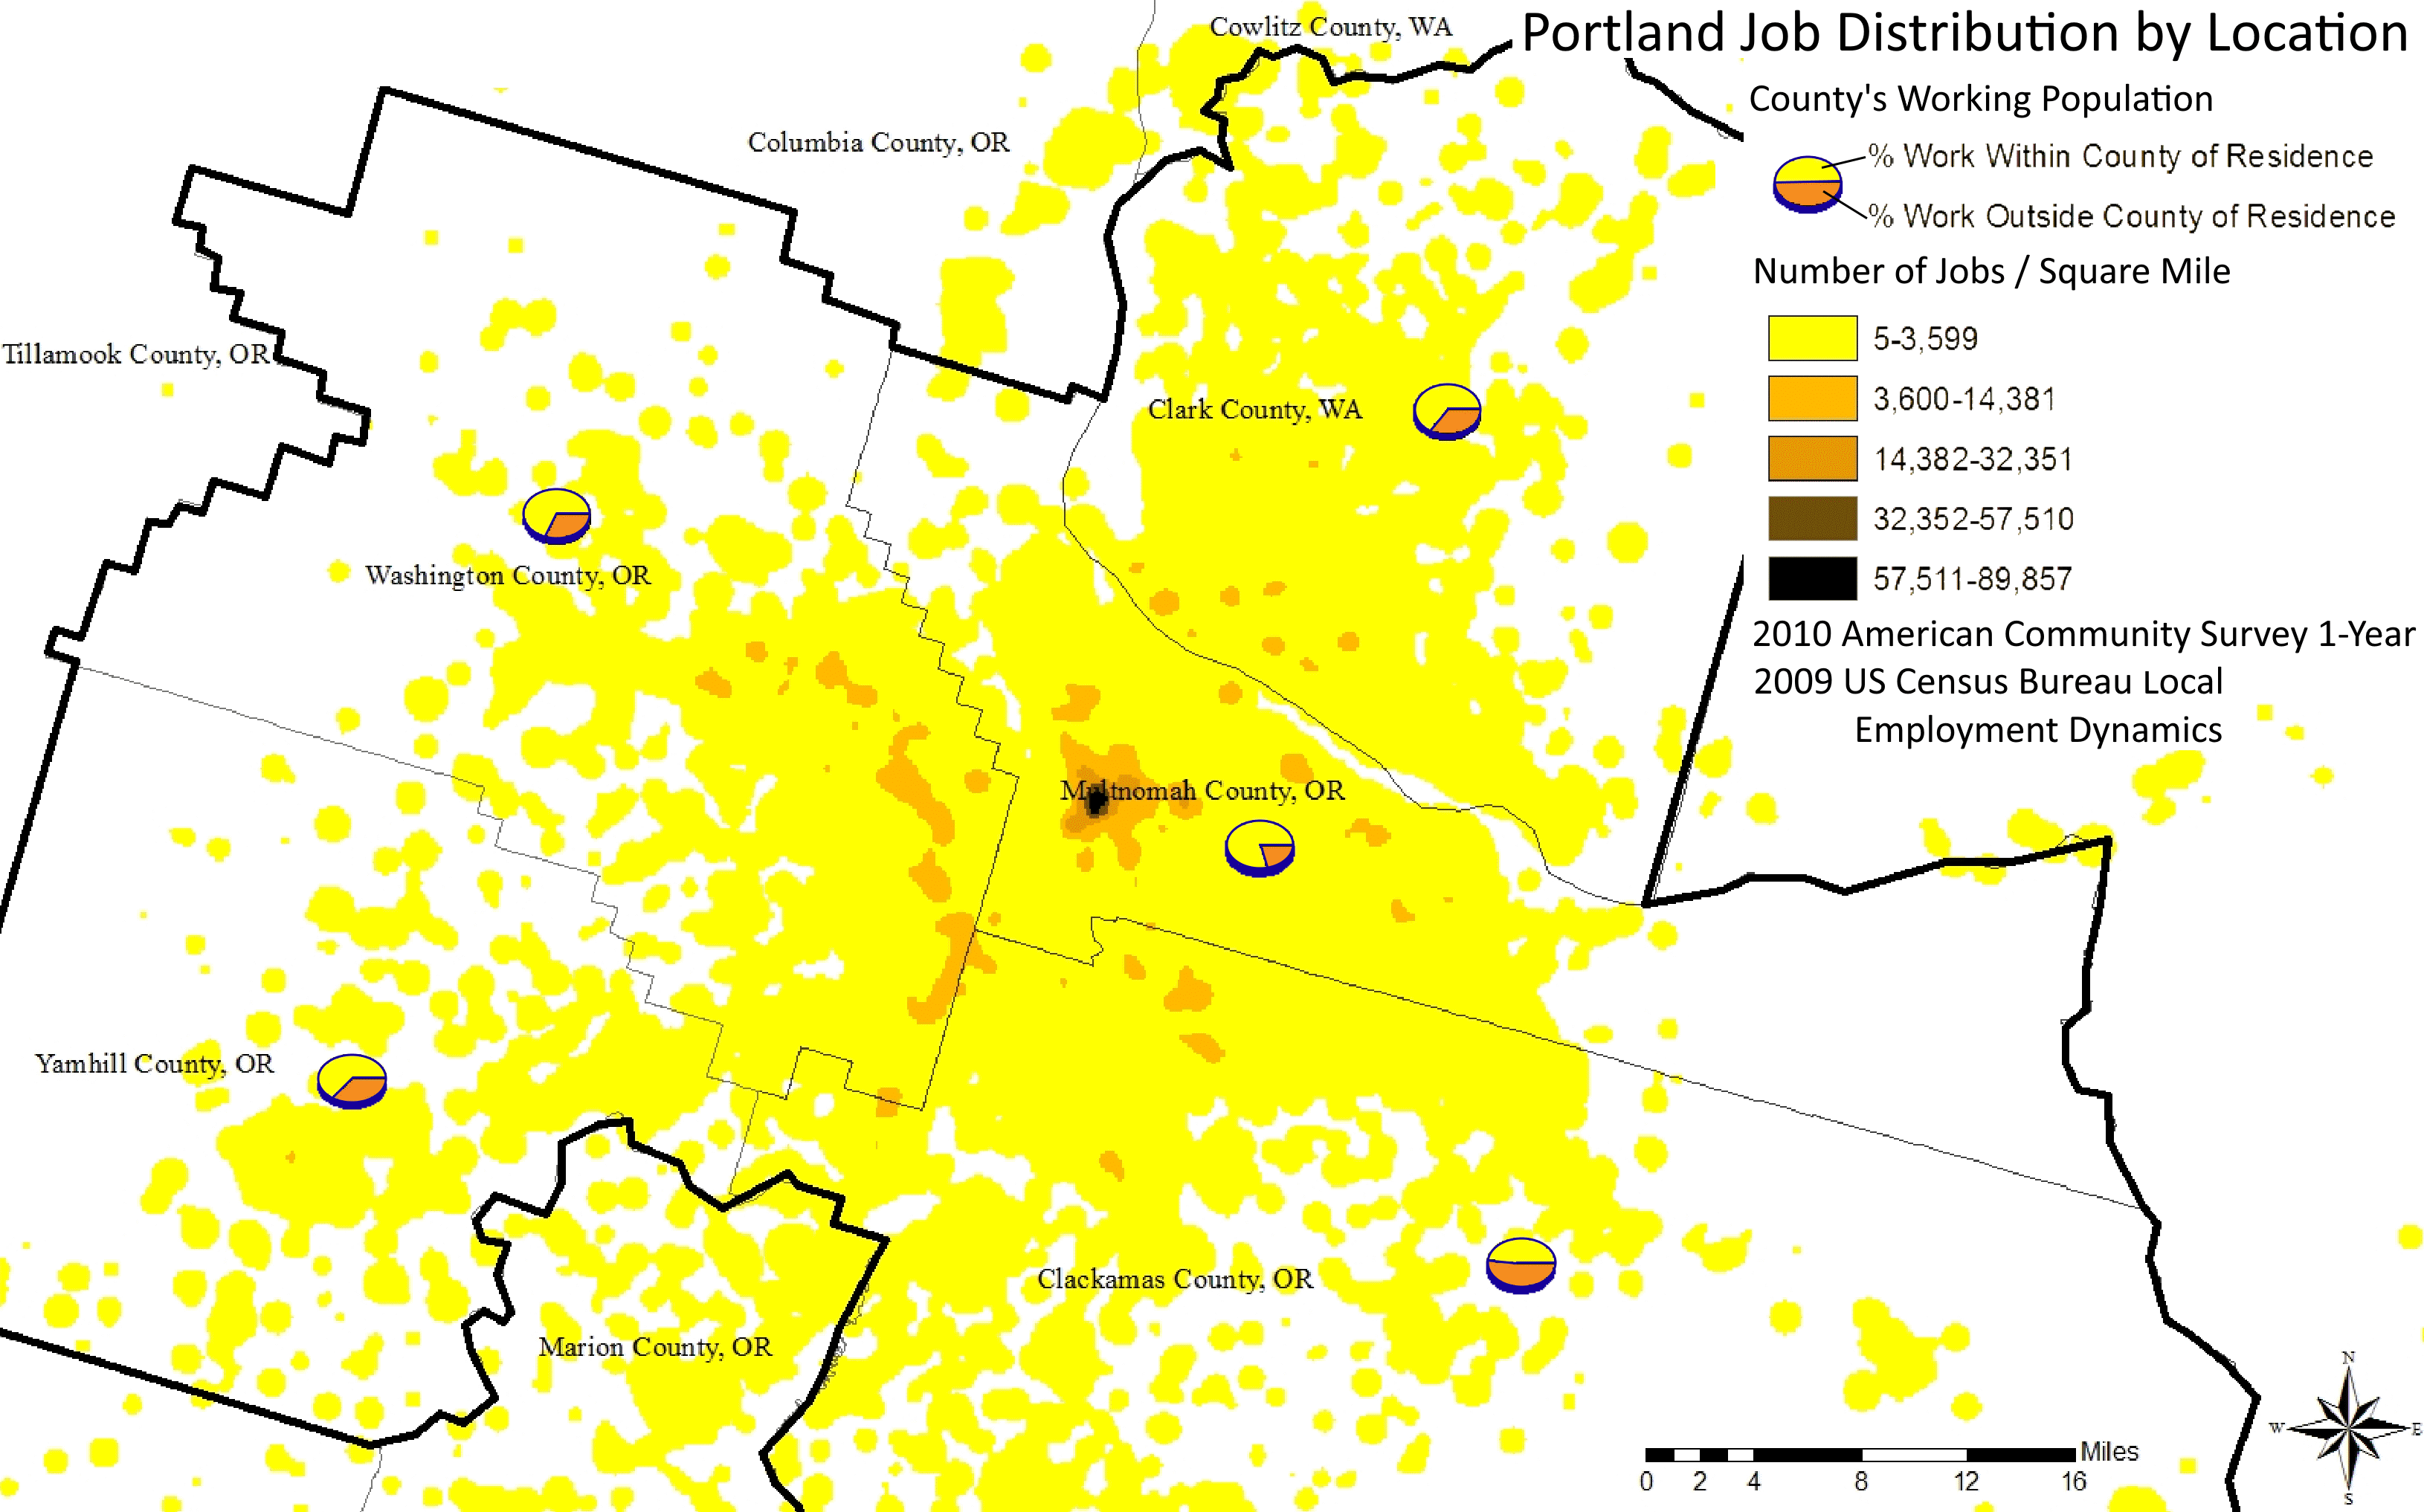
Like other cities with long-distance commuters driving alone in their cars Portland, Oregon strives to increase ridership on public transportation. A region with over 2 million people, during the years of 2009-2010 only 12% of their total workforce reported taking public transportation to work (data reported to the US Census Bureau). See the below maps and graphs for how this success of transport ridership varied per neighborhood. The number of commuters who chose to take public transportation has a positive correlation with both the density of public transit lines and the shorter distance people travel to work. Each of the five counties within Portland's metropolitan area had approximately 20-50% commuters who worked in a different county than they lived, with further away workplaces attracting people to drive alone in their car. Unsurprisingly, Portland put out traffic reports those same years showing congestion issues due to network bottlenecks and overloading of the main motorway routes.
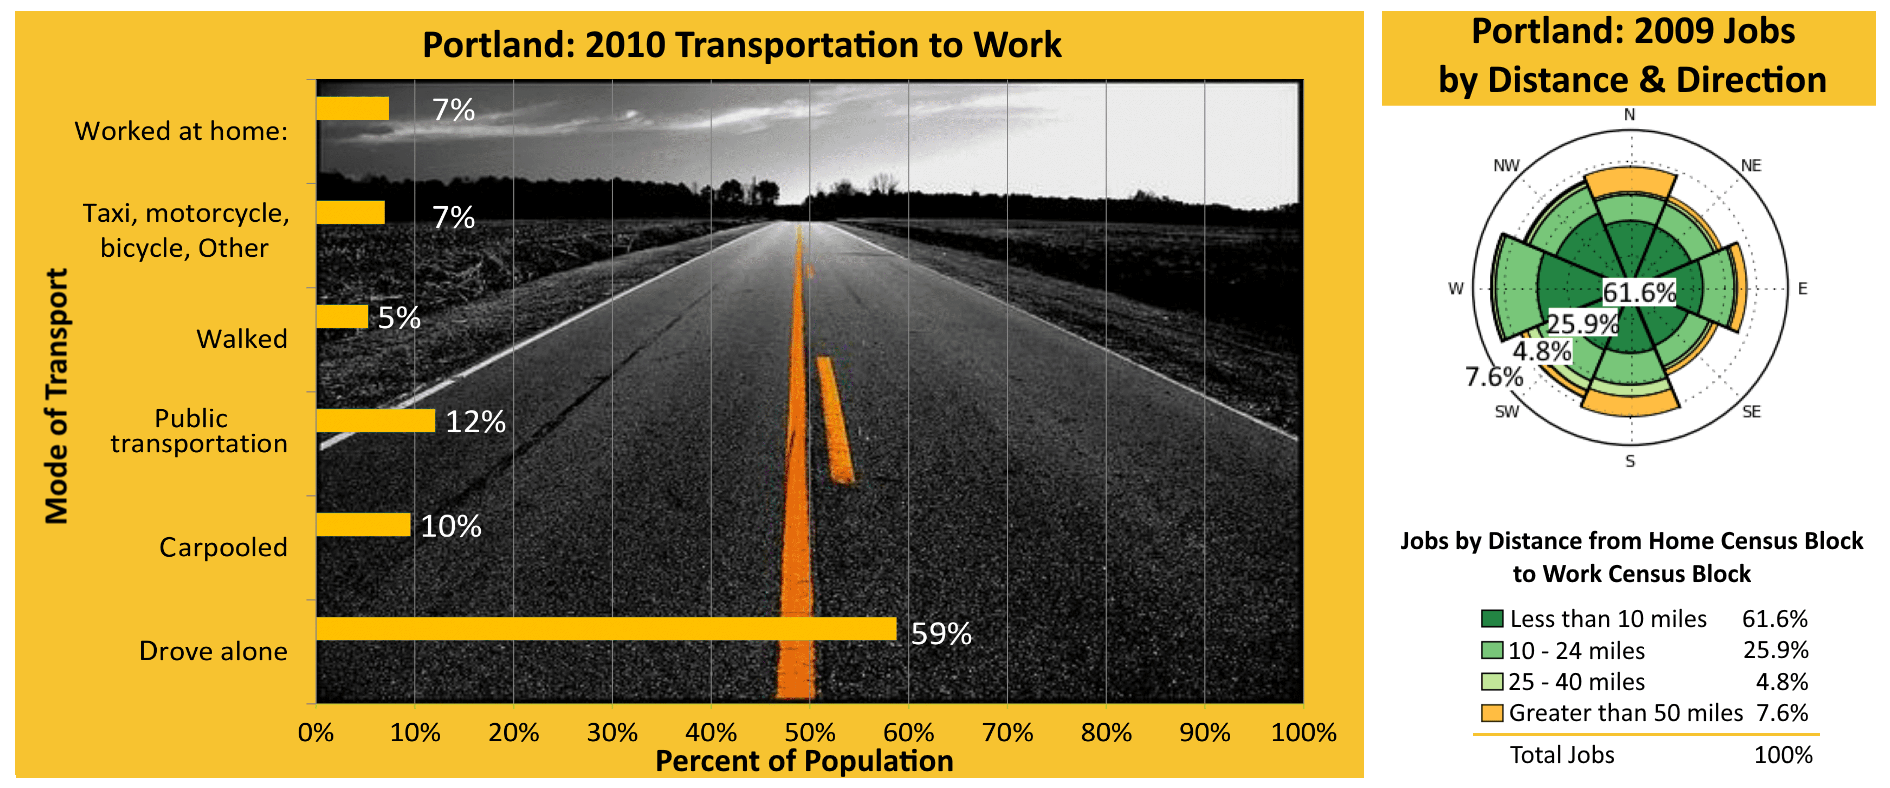
Due to these issues Portland Transport has made a huge push in both TriMet public transport and cycling. See their current progress for accommodating their cross-county trip takers.
Modal Share Feasibility: Identifying Where You Are & Where You Want to Be
Many planners and engineers believe balancing modal share is the best solution for reducing pressure on any given mode's network within a region. The logic being: if there are no other feasible ways to increase network connectivity and provide other route options, then there must be a new modal network added to accommodate the load going down those high-demand routes. This is a common problem for cities like Seattle, Washington and Vancouver, British Columbia where topography and water is an expensive constraint to overcome in adding to their road network. Both cities have dealt with it by adding boat ferries and light rail transit to these tight corridors.
GIS and Remote Sensing assist planners and engineers in determining their geographic constraints and which will be their most affordable modes and routes for both construction and longterm maintenance. In the next sections see how GIS and Remote Sensing data are used in both estimating cost of infrastructure and road life cycle assessments.
Cost of Implementing and Maintaining Transportation Infrastructure
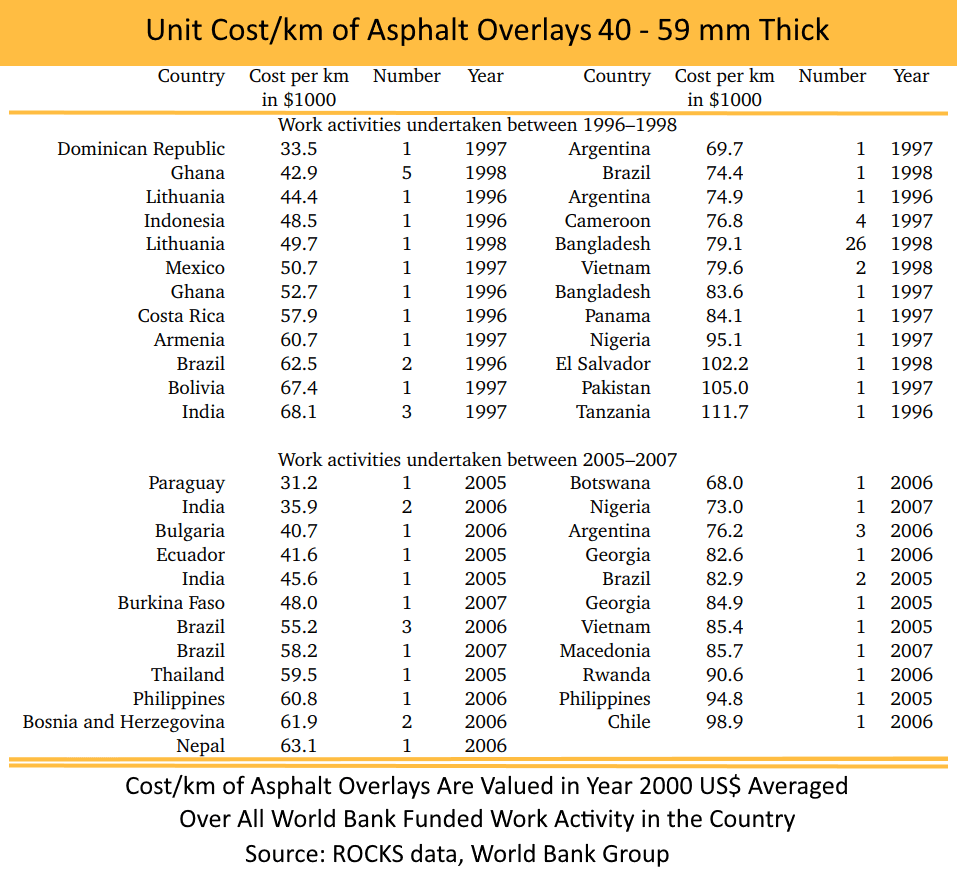
GIS is predominantly used in route assessment and asset management for financial reporting, improving future designs, and informing immediate maintenance decisions. According to the World Bank, roads are expensive and often more expensive than an economy can afford. The current expense of roads fluctuate due to their location and environment. There are universal cost variables like road width, terrain ruggedness, weather, and heavy-use which may require drawn-out construction, quick replacement, and intensive maintenance cycles. Then there are additional costs for situation and location, like how communities facing conflict have residual unit costs 30% higher than communities without conflict. These costs are unlikely to diminish as prices for skilled workers, equipment, and materials raise.
The same World Bank report states, "What is striking is that even for a narrowly defined time window and work activity, there are differences in unit costs of a factor between three and four. Using these unit costs, an asphalt overlay for a length of 100 km would cost US$3,300,000 in the Dominican Republic in 1997, compared to US$11,000,000 in Tanzania in 1996, or US$10,500,000 in Pakistan in 1998."
Road Life Cycle Assessment
Overall costs for developing a roadway and the longterm usage are summarized in life cycle assessments. These assessments often require GIS data as well as local construction requirements, material manufacturing information, and traffic modeling projections for the 20-30 years a road is expected to function. Specifically, a Pavement Life Cycle is highly dependent on its material composition, environmental factors, and intensity of use. However, these cost and life cycle assessments vary greatly depending on the country using them. GIS becomes even more important for roadway life cycle assessments if following European Union standards, which include robust environmental impact assessments for all pre and post construction activities. Going so far as to include air quality and climate change impacts from construction and maintenance vehicles for the road's life cycle.
GIS and Remote Sensing are particularly useful to life cycle assessments during the early stages of planning sustainable transport infrastructure. With more affordable and precise assessments of current pavement conditions using techniques like ground penetrating radar as a non-destructive alternative to traditional cross-cutting pavement assessments.
Such road costs can be anticipated and reduced by proper tracking, enforcement, and shifting the heavier load bearing traffic into different modes which may be better designed to take those loads. This is one reason the Netherlands and Germany built a heavy-industry rail line. The Betuweroute is a double track freight railway from Rotterdam to various German destinations. It totaled a cost of €4.7 billion, but today allows reliable, quick, and affordable transport of extremely heavy materials and equipment between countries. This makes a lot of sense considering a road can be ruined if too much weight is placed on it too often. One study found overloaded vehicles increase life cycle costs due to pavement damage by an additional 30% compared to legal vehicle loads. This presents a dilemma as there will always be heavy loads to transport. While each road and motorway is engineered to a certain weight rating for a certain number of trips by that load category, increasing those weight ratings can be extremely expensive. Thus, why alternatives like rail transport are so attractive.
Stakeholder Analysis: Identifying What Convinces Car Drivers to Bike
As the European Union's PRESTO so clearly argues, "a clear and systematic framework to help decision makers" is the most reliable way to promote cycling for everyone as a daily transport mode. Identifying what would convince car drivers to bike requires clear and systematic assessments like Stakeholder Analysis of a community's biking target groups. Stakeholder Analysis provides an assessment on how each cycling target group perceive the current cycling conditions in their community and identifies what each group thinks are the major problems to be addressed. Even active and recreation-focused communities like what you typically find in New Zealand struggle to increase their biking modal share. Pushing transportation planners to answer questions like: why do the same people who love to recreate and stay healthy predominantly use their cars for their most regular trips? This is one of the many questions Christchurch, New Zealand needed to answer in 2014 while planning a NZ$170 million redesign of their urban bicycle network.
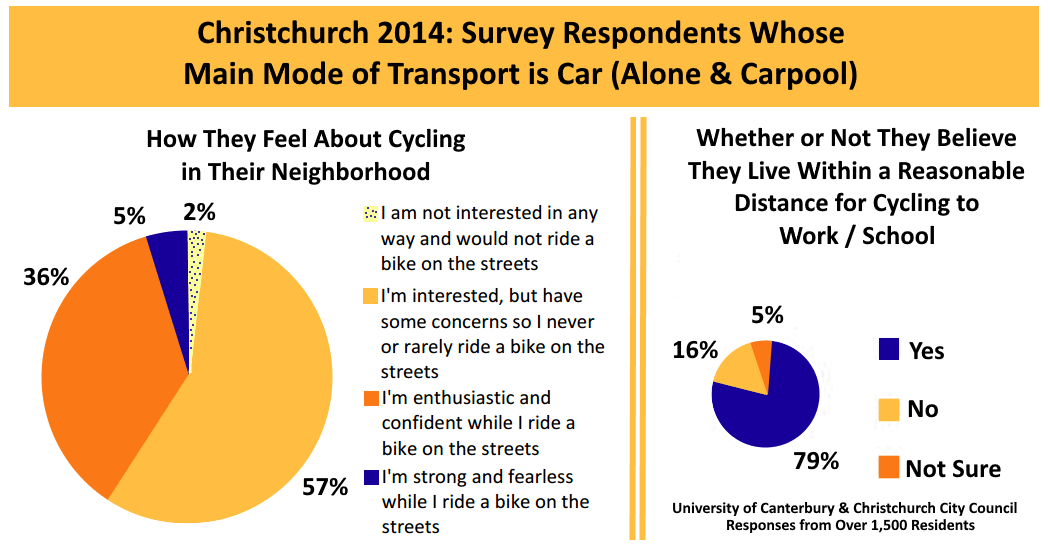
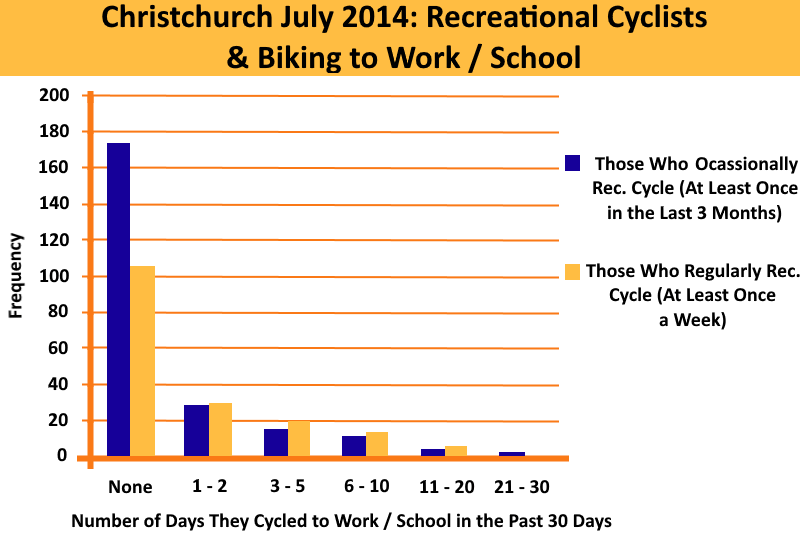
While our analyst worked in Christchurch, New Zealand they helped the local Transportation Manager and University of Canterbury traffic engineers assess why people of certain demographics tend to choose certain modes. From here they were able to define target groups for Stakeholder Analysis. Reasoning a well understood target group is one you'll be more likely to convince to bicycle.
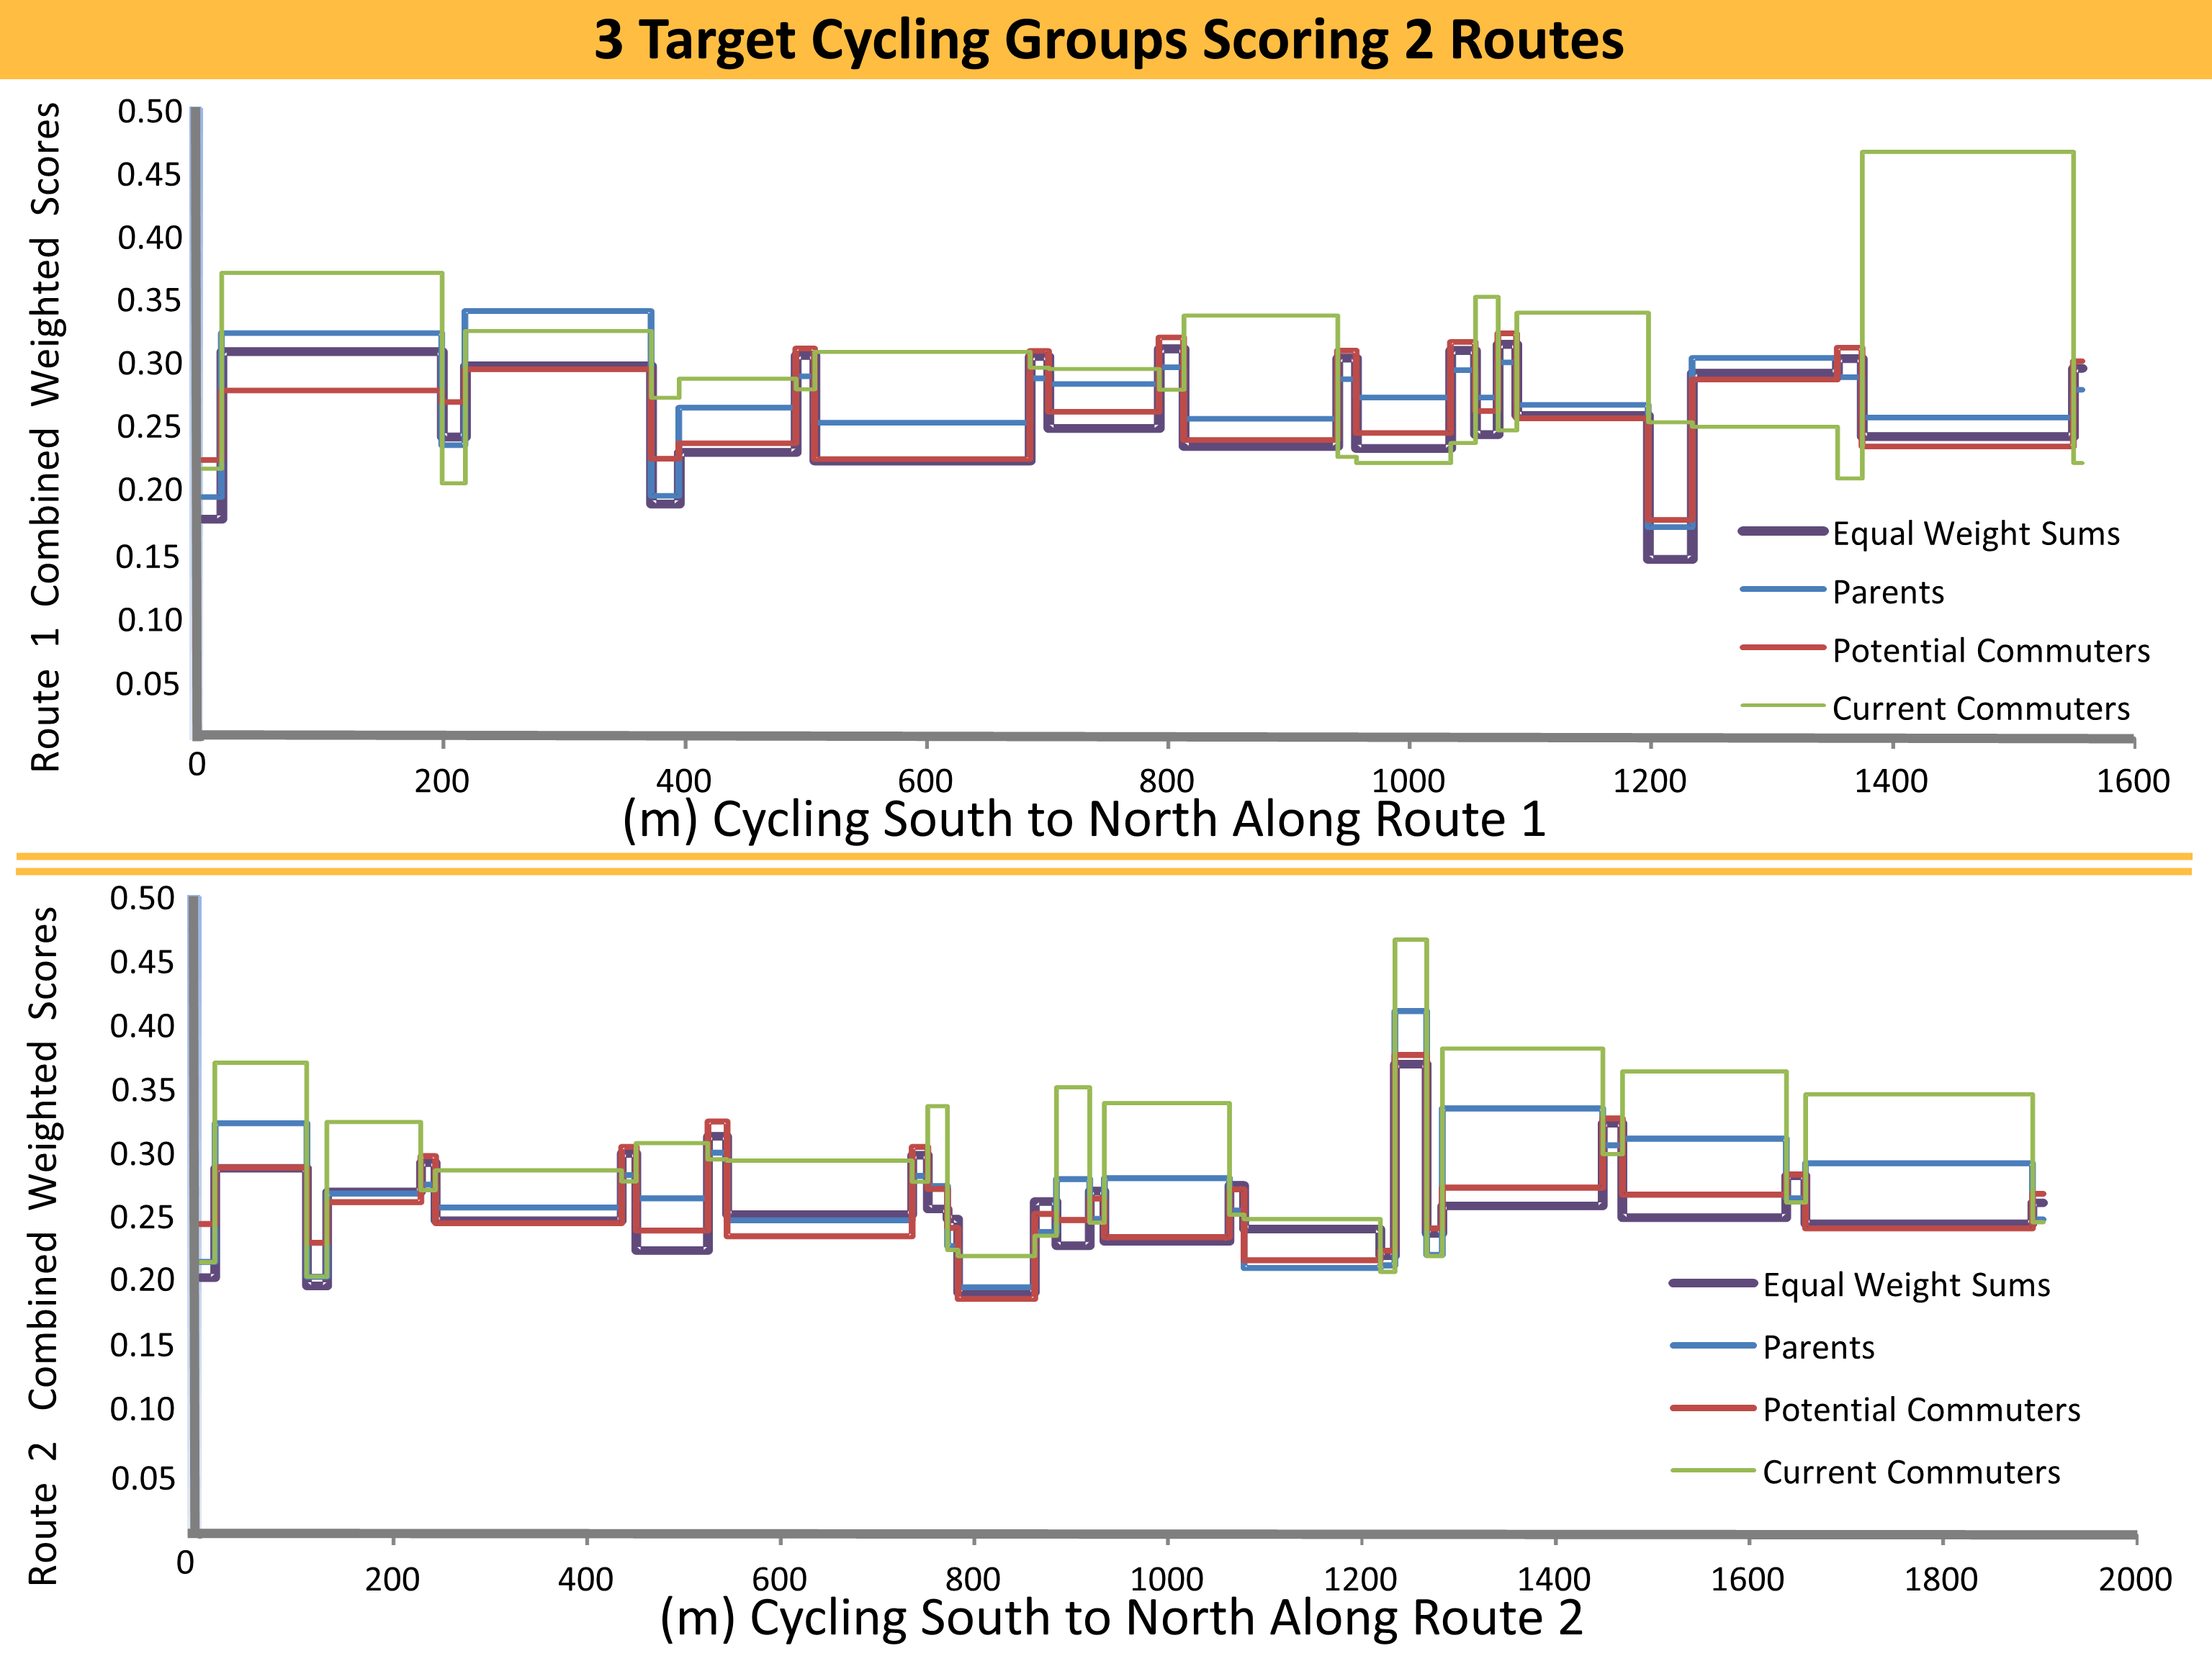
Route Assessment: Criteria Your Cycling Target Groups Desire in a Route and Finding Those Roads in Your City
A good network is all about options, connectivity, and safety (see the Dutch and Danish guides for well designed bicycle networks). Identifying the "problem areas" is just as important as locating already good routes. By finding and putting budget towards fixing unsafe and unfriendly biking locations in high-demand areas you open up many more options for your bike network. It can be as simple as scoring a route for how well it fits the needs of your target cyclist groups. The below graphs show how two possible school bike routes were scored by the Christchurch target group "Parents of Children Aged 10-17", which highlights how those important safety criteria like "visibility" to traffic and street "lighting" compare.
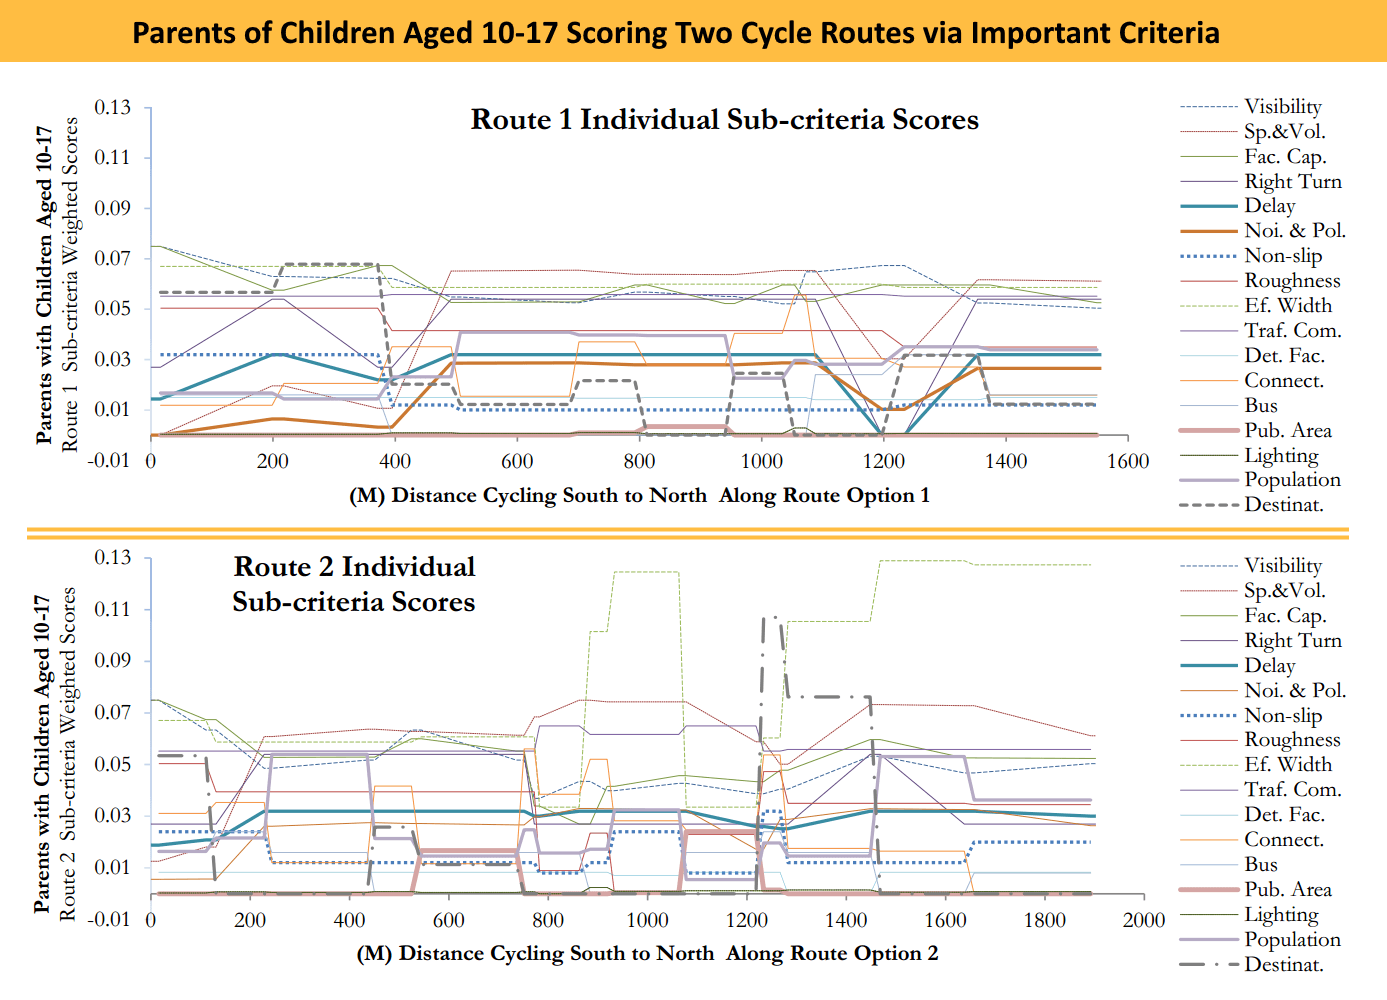
Better yet, summarizing exactly where these important criteria score poorly on the potential routes identifies how the route would better appeal to a target cycling group if those locations were redesigned. A.k.a helping answer the question, "Where are the problem areas and how do we need to fix them?" By fixing a route's problem areas we make them more functional for each cycling target group. If an entire route can be made functional for all a city's target populations (like the three shown in the graphs below), then the infrastructure is much more likely to be used.
Web Maps and Mobile Apps Helping Focus Groups
Our analysts at GIS Sensing build tools to assist transportation planners setup and run focus groups. By use of web maps, comment threading, and survey polls our analytical tools help focus groups continue discussions and define areas or subjects which matter most to them. Data can be filled out online at the participant's home or their mobile device while at the focus group's venue to engage your community.
The below responses came in from the latest focus group using GIS Sensing's tools. This particular focus group was formed to identify how their city could improve bicycle friendliness. Much of their conversation focused on cycle network design and maintenance, with some of the major messages shown below:
- 100% of this focus group agreed there was a problem with street cleaning on (often narrow) cycle lanes. Generally, there is "broken glass or debris in the cycle lanes and sometimes things just get pushed from the roads and are stuck in the gutters, overflowing into the cycle lane."
- "In our city, right now there's no easy way for people to offer advice on which areas or designs need infrastructure improvement. Nor can people easily report when the cycle lanes are in poor condition and need maintenance. There should be an App for people to give constructive, location-specific maintenance and infrastructure advice."
- 90% of the focus group claimed to like the "reflective design additions (like flexi-posts and raised curbs) at intersections, as it protected the cycle lane and provided better visibility than simple paint or low barriers."
- Over 40 locations within the current cycle network were identified to have road designs unsafe for cyclists. Intersections, sharp corners on high speed roadways where cars cut into the road shoulder, insufficient bike lane space where it's likely to be hit by a parked car's door, high-speed roundabouts without additional protection, and more.
- 90% of the focus group said they'd experienced problems with cars "parked in the road median."
- One participant received a lot of responses to their comment relaying, "As a parent, ideally any road should be safe for kids to ride to school. School / Home trips will be different routes for all children, and children like to have independence to go visit friends, ride to sports practices, etc. If there were more cyclists of all ages on the road I would be more comfortable with my children cycling."
Other focus group comment threads informed the local Transportation Managers and Planners their bicycle programs might be more successful if they addressed the below behavior and perception issues:
- 60% of the focus group agreed there is "an anti-cyclist sentiment" in their city, that "people tend to think all cyclists wear lycra or all cyclists run red lights."
- 75% of the focus group agreed, "Perceptions of safety improve once people start cycling themselves. Then, people are also better able to see the direct benefits. Benefits being: environmental value, cycling can be just as fast for time, and cyclists save money from not buying petrol while getting a more continuous travel experience without as much idling."
- 80% of the focus group agreed they'd seen "cars not giving the right-of-way to cyclists when they should", instead cutting them off to turn at an intersection or presenting other dangerous scenarios.
- The below behavioral issues received a lot of feedback, with 75% of the focus group participants saying both drivers and cyclists could improve their behavior on their city's roads.
- "We need to decrease tension between cyclists and car drivers. Currently, its easy to overlook empathy and forget that those cyclists aren't just annoying but are people. They might be a doctor, a mother, or your neighbor."
- "Cyclist behavior needs to improve, because many do not know the laws, or are riding unsafely, or simply give cyclists a bad impression to drivers. Currently, drivers don't know what to expect from a cyclist, increasing risk of a collision."
- "Our city's bike lanes are good, but the main issue for cyclists is driver behavior. Drivers need to be more careful and considerate. This only happens if there are lots of cyclists on the road and they are used to seeing them and accepting them as part of normal traffic."