Environment
Most of our advances for GIS and Remote Sensing came from Aeronautics and Military achievements. Technology used in these achievements were then used to keep track of, assess, and improve our natural resources. Since the 1970s GIS and Remote Sensing have become fundamental to the fields of Climatology, Ecology, Environmental Engineering, Forestry, Geology, Hydrology, and Wildlife Biology.
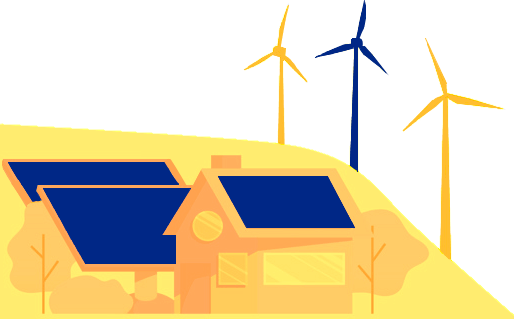
Climatology
Monitoring is essential for understanding how climate changes and affects the resources we depend on. The latest research in Climatology pairs ice cores, soil samples, and other historical data with current high resolution hyperspectral imagery. This hyperspectal imagery improves scientists' ability to detect material such as ice sheets or snow-covered ground and assess how these large processes are changing. Additionally, it allows an incredibly precise look into the world's adaptive land cover as individual plant species can be detected for their state of health. This hyperspectral imagery when paired with Lidar and Radar of changing wind, temperatures, water levels, and weather patterns give a better look at the world's climate than we've ever had before. GIS and Remote Sensing are helping our climate scientists make better predictions which at-risk communities then utilize to further resiliency or sustainability efforts.
Ecology & Biodiversity
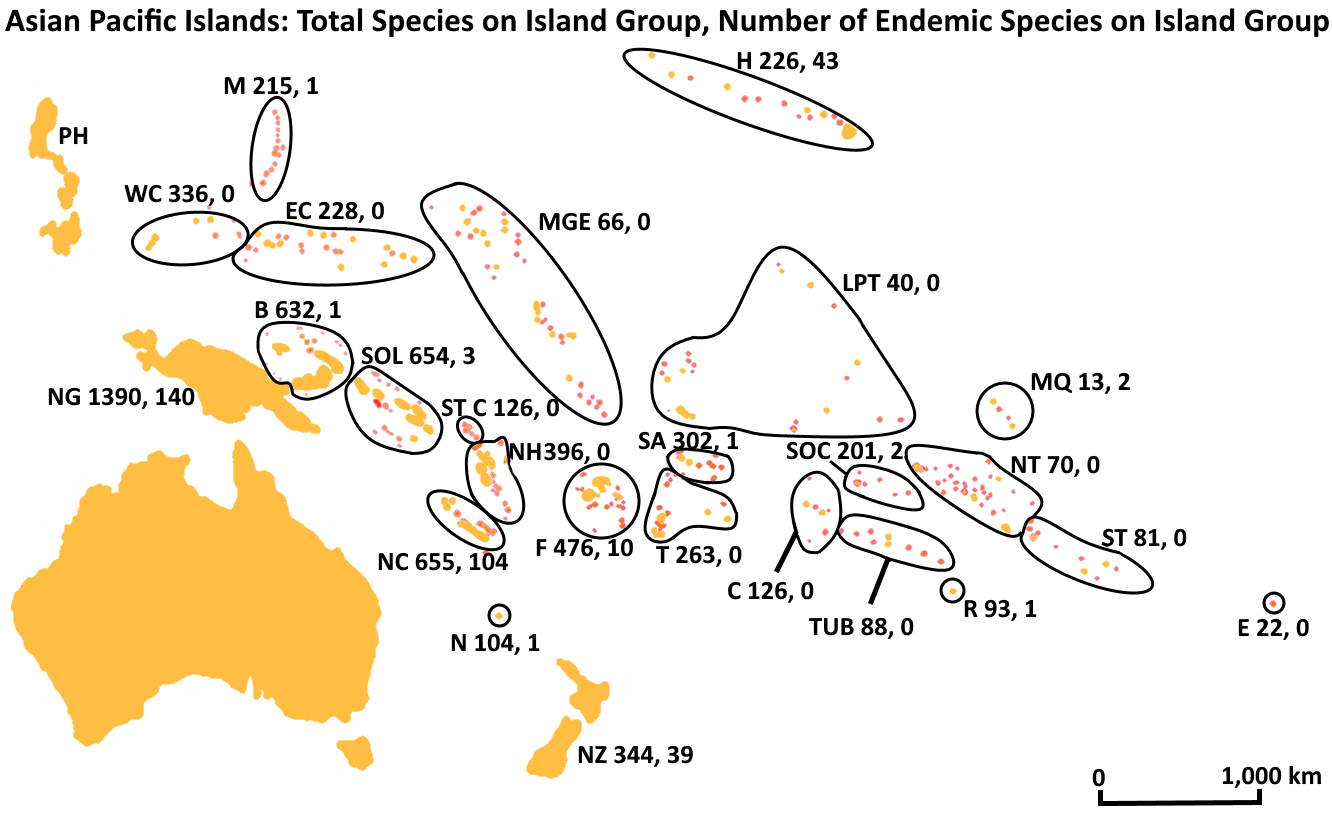
Locating and tracking species are imperative for migration and population studies. These studies go on to affect environmental policy and local conservation efforts. GIS and Remote Sensing are the tools for building and assessing this data over large areas, pulling together field surveys and observations into databases so patterns and trends for any given species can be identified across regions.
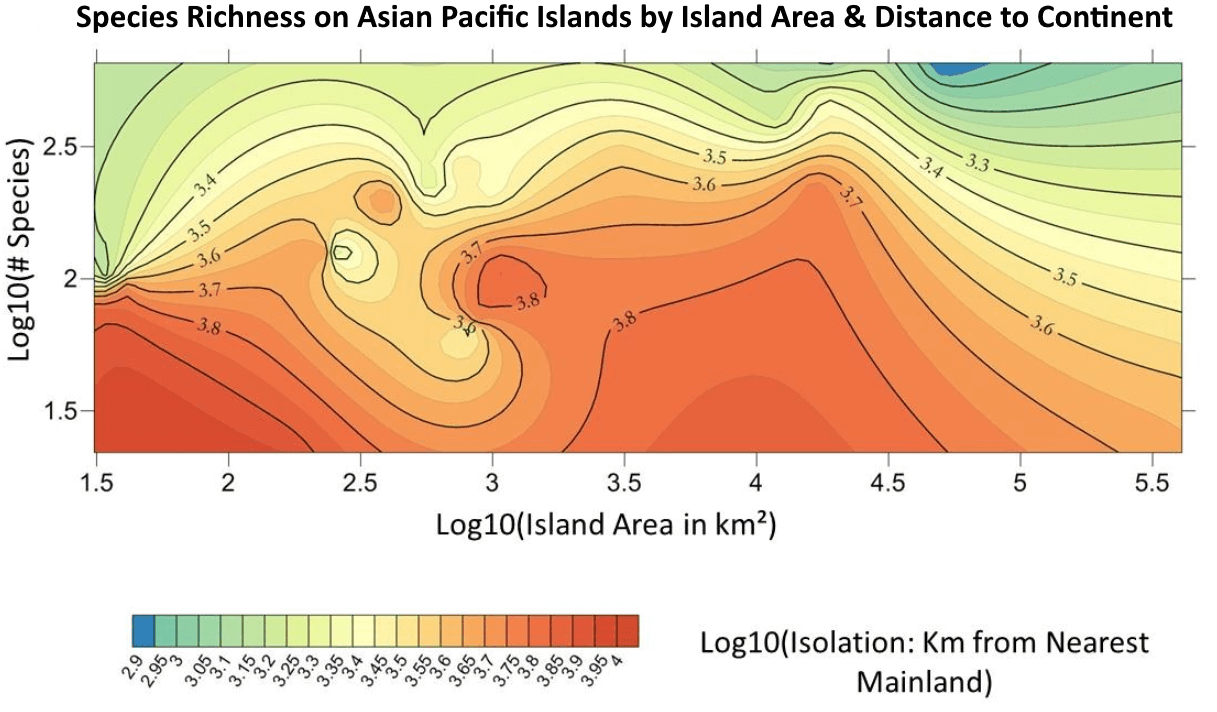
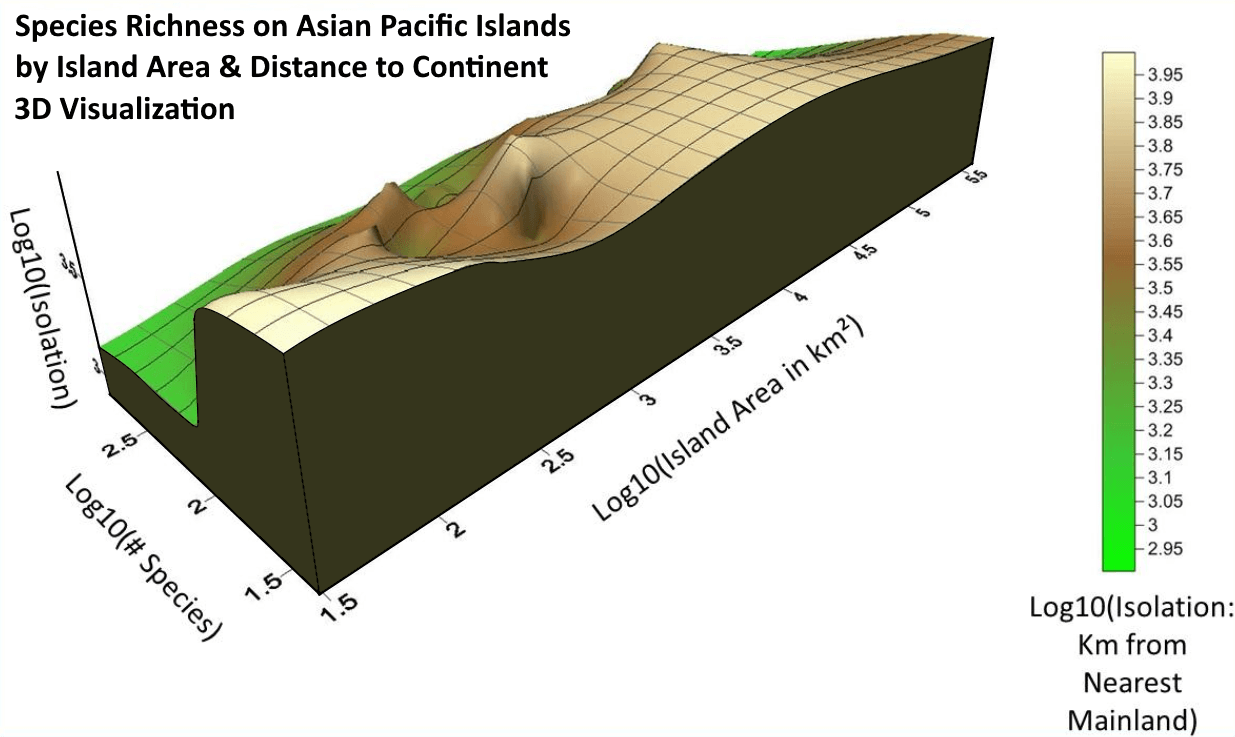
When working with University of Montana data (Data Source: Natalie Dawson), one of our analysts looking into biodiversity in the Southeast Asian Pacific Islands and discovered species richness on those volcanic islands is correlated with the island's distance to a geologic continent like Australia.
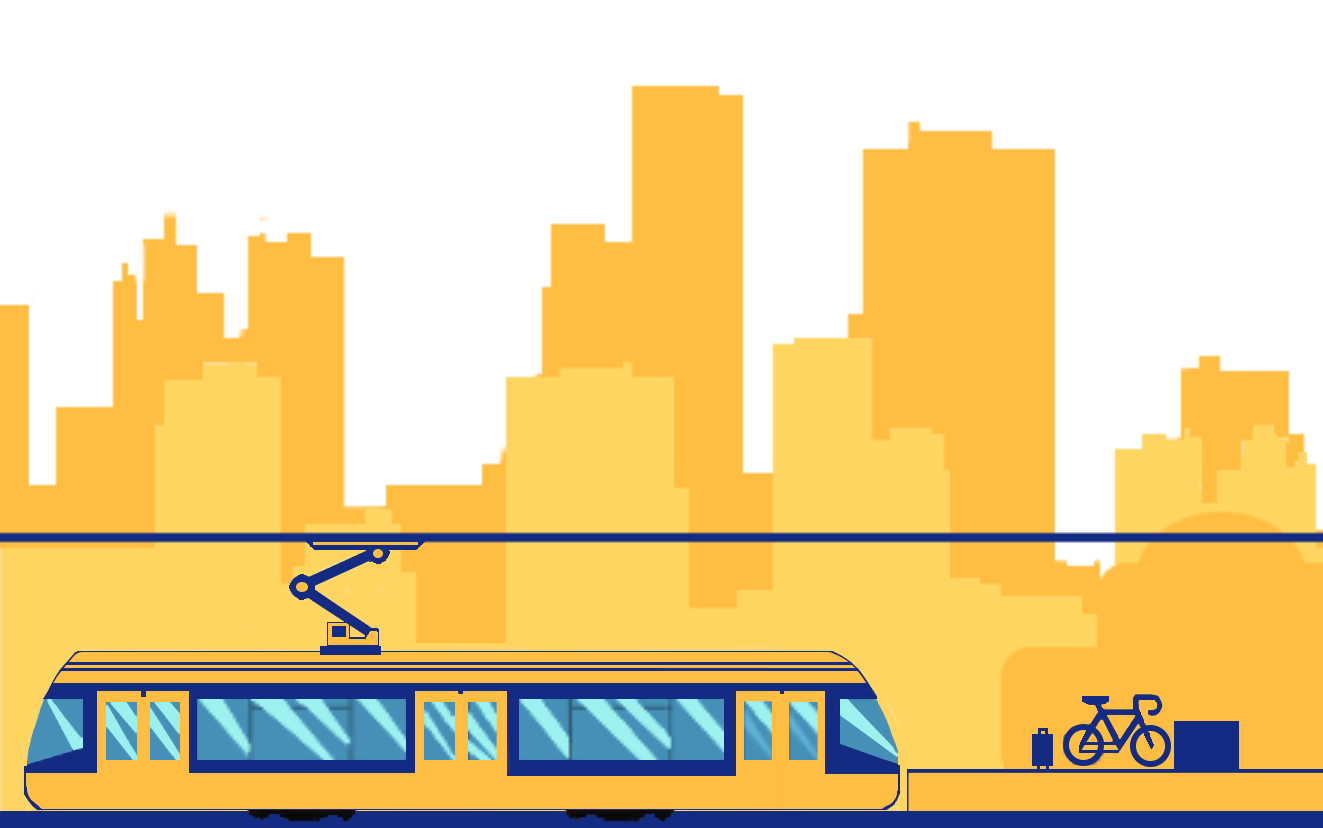
Environmental Engineering
This line of work is all about assessing limits and increasing the health and safety of those communities who will use the infrastructure they're designing, with almost all of these engineers using some form of GIS during their planning phases. Since Environmental Engineers deal with dozens of variables, each with a different expected degree of freedom, their models rely on industry-standard data collection for each variable affecting the system they're protecting. Many Environmental Engineers use a combination of spatial datasets such as geology, hydrology, or meteorology to determine what scale of event will affect designs for their project's site. Those results shown in their GIS databases will likely influence what controls need to be implemented and what kind of warning procedures need to be put into place should something go wrong. Any engineer working on industrial facilities generally have built-in precautions and written staff procedures to follow in case of spills, fires, leaks, etc, all designed for their site's location. These environmental risks will be further monitored throughout the project's life cycle, whether via periodic engineering inspections or monitored in real-time SCADA software. Together, these spatial databases become essential for negating system failures to keep equipment within functional thresholds, the environment healthy, and people safe.
Forestry
Forests are such a valuable resource. Our ability to track, transport, and sell products from our forests and their recycled materials have made it one of the world's largest and most reliable markets. In 2017, Canada and the United States exported approximately $70 billion in their combined "Forest Products". On a local level, rural communities who normally wouldn't be able to raise education money via taxes are instead funding their children's education with well-managed forestry programs. States like Oregon, Montana, and Washington fund much of their Kindergarten through High School education programs from these DNRC Lands Trust Management lumber sales. GIS and Remote Sensing are how these regional and national timber stands are inventoried. These technical tools and spatial databases have become crucial for the largest land managers who are now working on scales netting product revenues in the millions and billions. For these land managers, high precision mapping techniques become solid investments. The improve species inventories on location, height, and density of stands. These inventories then help determine sustainable best management practices and determine which stands need to be thinned to reduce risk of forest fire. Due to its large economic impact, forestry programs are now the forefront of wide scale GIS and Remote Sensing applications.
Geology
Geologists have been documenting location and characteristics of soils long before the advent of computers, GIS, and Remote Sensing technology. However, the presence of these have drastically changed the study and implementation of geology in different industries. Just a few of the exciting advances made available through GIS and Remote Sensing:
- Ground penetrating radar for viewing coral reef architecture and designing adequate forest roads for substrate elements;
- Earthquake early waring systems via S-wave monitoring;
- Geomorphology modeling for levee subsidence and landslides; plus
- Lidar to scan and calculate flood protection failure.
Hydrology
GIS and Remote Sensing for hydrology allows additional protection against water pollution, allows calculations and modeling for underground riverine systems and aquifer movement, flood hazard risk assessment, weather prediction for water scarcity planning, and more.
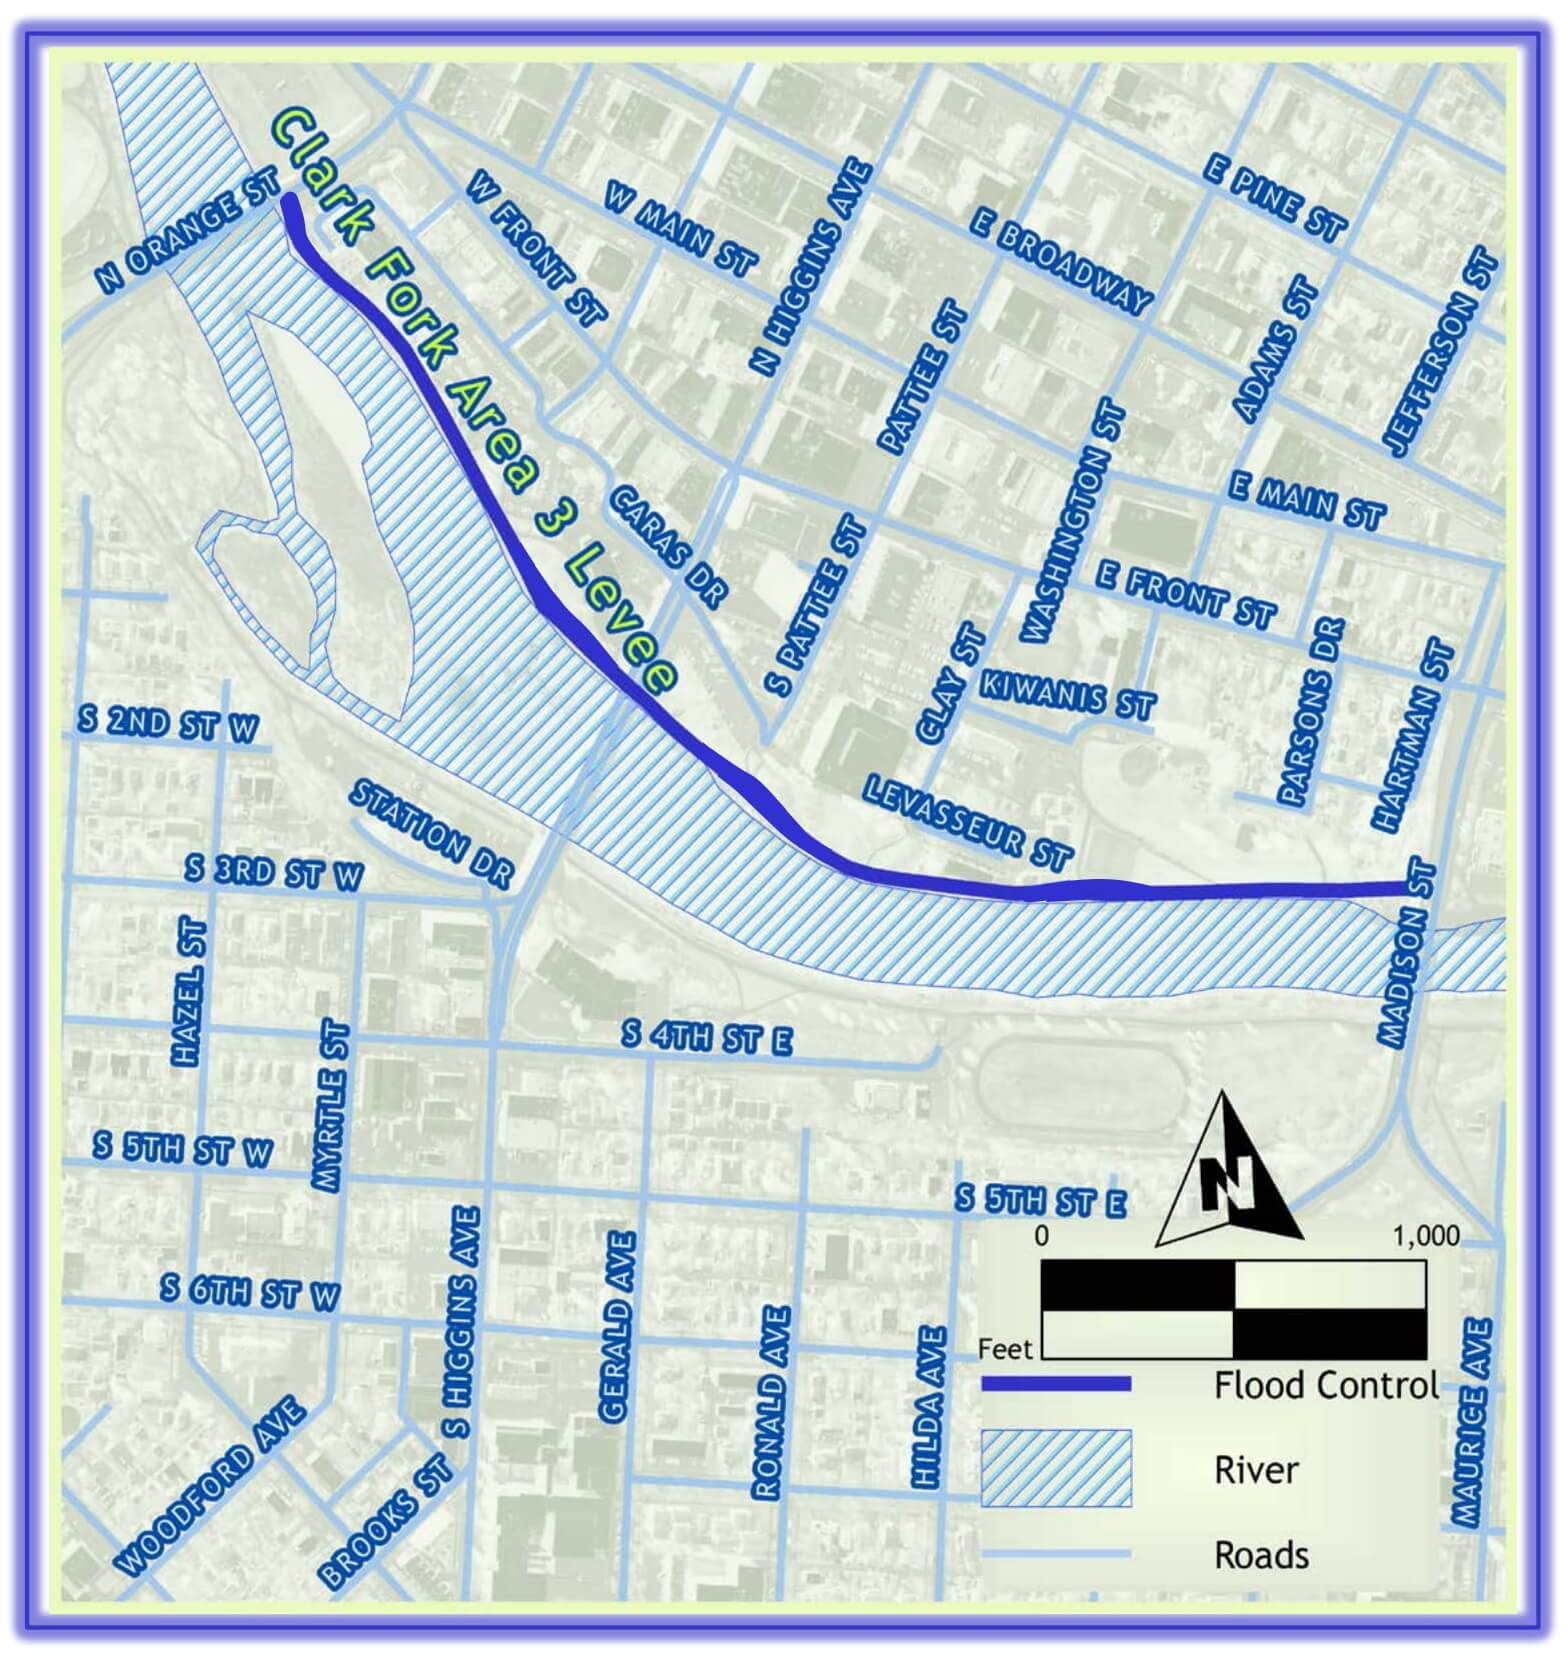
One of our analysts worked for the City of Missoula mapping flood protections and soils which impact storm water drainage. Through this work planners can better regulate future developments to meet storm water system requirements and drainage needs on each site.
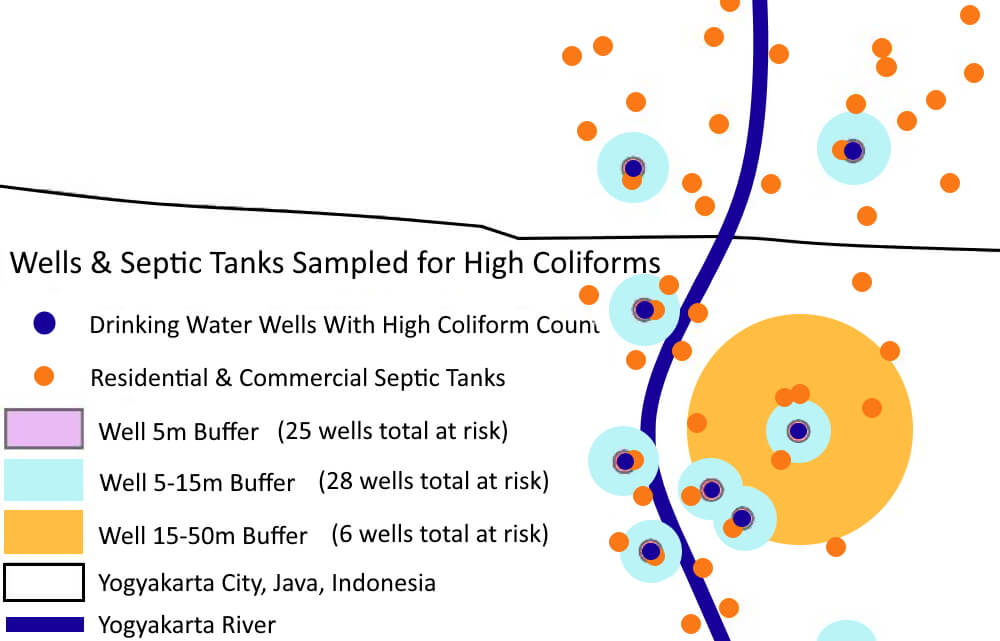
Additionally, when Javanese people were getting sick due to coliform (E.coli) contamination we used University of Twente's data to map water pollution in the Yogyakarta, Indonesia's largest river valley. This mapping helped pinpoint possible pollution sources due to proximity and source of those contaminated drinking wells. Of the total identified drinking water wells along the river valley, 25 were within 5 meters of a contamination source and 28 wells were between 5-15 meters away.
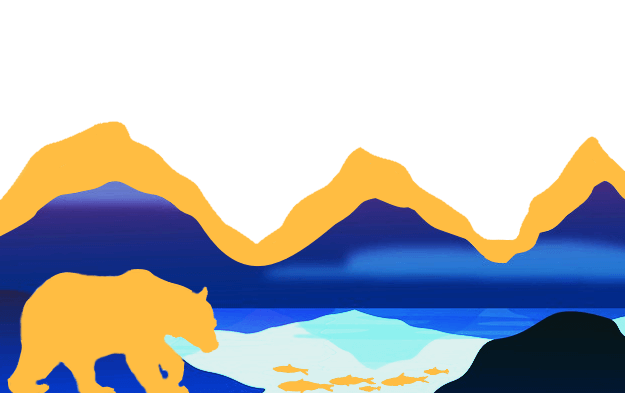
Wildlife Biology
GIS is used heavily in biology for tracking success of wildlife intervention programs. From reintroducing species to an ecosystem where the population has died out to preventing spread of invasive species.
Our analyst worked with biologists from Montana Fish, Wildlife, and Parks to see the effectiveness of Bear Relocations. For this we identified where the individual bears had been relocated from, to where they were placed, and identifying whether or not they returned. Surprisingly high rates of return happened even for bears who were relocated several hundred miles. Unfortunately, these bears who failed the relocation program would have to be put down. This project provided evidence that some bears respond better to behavioral deterrents such as those used by the Wind River Bear Institute. Since the conclusion of our 2008 analysis these programs have grown more popular throughout the Western US. Now states like Washington now have full Karilean Bear Dog Programs.